Sri Lanka’s economy on the right track
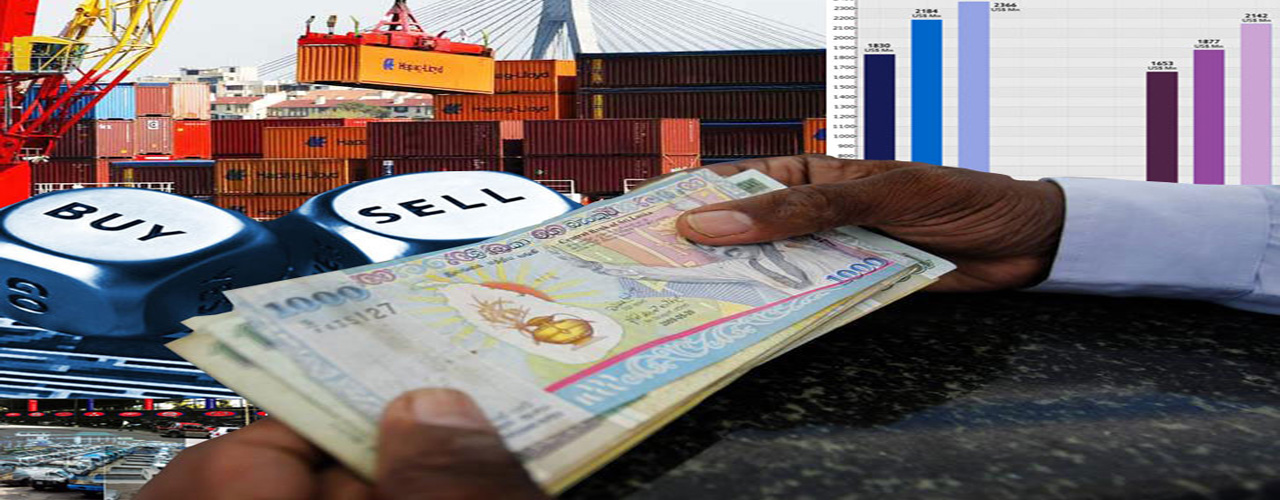
According to the Central Bank, the island’s July trade deficit shrank 10% from a year earlier to $ 541.6 million.
- Exports continued their decline, reducing 4.4% to $ 891million.
- Imports contracted 6.6% to $ 1.4 billion compared to the same period in 2015.
- During the first 7 months of 2016, the overall BOP is estimated to have recorded a surplus of $ 356.0 million, compared to a deficit of $ 1,229.6 million recorded during the corresponding period of 2015.
- Sri Lanka’s gross official reserves increased to $ 6.5 billion by end July 2016 with the proceeds from the dual tranche international sovereign bond issuance and the Syndicated Loan facility.
- The gross official reserves were equivalent to 4.2 months of imports, while total foreign assets at $ 8.9 billion were equivalent to 5.7 months of imports.
- Total earnings from tourism increased to $ 1,945.2 million during the first 7 months of 2016 compared to $ 1,667.1 million recorded during the same period in 2015.
- The top 5 sources of tourist arrivals in July 2016 were China, India, the UK, Germany and France, accounting for 49.8% of the total during the month.
- Remittances from workers declined by 4.4%, year-on-year, to $ 572.8 million in July 2016 from $ 599.3 million in July 2015.
- According to the report earnings from exports during the first 7 months of 2016 contracted by 5.6%, year-on-year, to $ 5,999 million mainly due to reductions in export earnings from transport equipment, petroleum products, tea and spices.
Contribution of agricultural and industrial exports:
- Owing to lower international commodity prices and lower domestic supply, export earnings from tea dropped by 14.8%, year-on-year, to $ 108 million in July 2016.
- This was clearly the case with Russia and Middle Eastern countries.
- However, tea exports to Iran increased in comparison to July 2015.
- Also, earnings from the export of spices declined significantly by 31.8%, year on-year.
- This was mainly attributed to the poor performance of pepper and its low domestic supply volume.
- Cinnamon, nutmeg and mace exports on the other hand showed considerable growth, year-on-year, in July 2016.
Seafood exports declined, year-on-year, both in terms of export value and volume in July 2016.
However, as a result of the removal of the fish ban imposed by the EU on Sri Lanka, earnings from seafood exports to the EU grew by 19.9%, year-on-year.
Due to higher garment exports to the EU and non-traditional markets such as Canada, China, Australia and the UAE, earnings from textiles and garments exports grew by 3.0%, year-on-year, to $ 426 million.
Garment sector contribution to total export earnings was around 48%.
A higher performance was recorded in the footwear and travel goods subcategories.
Export earnings from leather, travel goods and footwear grew substantially in July 2016.
Other top performing sectors for July 2016:
- Machinery and mechanical appliances.
- Base metals and articles.
- Vegetable exports.
The leading markets for merchandise exports (accounting for about 53% of total exports):
- USA
- UK
- Germany
- India
- Italy
Foreign investments:
- The CSE recorded a net inflow of $ 10.1 million in July 2016.
- The government securities market recorded a net inflow of $ 238.5 million in July 2016 continuing the trend observed from the latter part of April 2016.
Export earnings from petroleum products:
Owing to the combined effect of lower bunkering quantities and average bunkering prices, export earnings from petroleum products decreased by 24.7 %, year-on-year.
Expenditure on imports:
Expenditure on imports contracted by 6.6%, year-on-year, to $ 1,433 million in July 2016 compared to $ 1,534 million in July 2015.
Vehicle imports, fuel and wheat imports, contributed largely to this reduction.
Import expenditure on machinery and equipment and building materials increased noticeably by 25.4% and 14.4%, respectively on a year-on-year basis in July 2016.
Expenditure on mineral product imports increased significantly by 125.4%, year-on-year, in July 2016 mainly due to higher imports recorded in cement clinkers.
OSL Take:
A snapshot of July 2016 tells that Sri Lanka is getting back to better governance and some predictable order.
However, the country has a long way to go in terms of its 2030 national goal setting and the Western Region Megapolis Masterplan’s (WRMM) funding drive would hopefully increase the growth momentum for the benefit of the masses.
OSL as the pro-active promoter of the 140 projects outlined in the WRMM now invites potential overseas investors to use our local matchmaking skills to bid for the projects offered on the PPP model of investment.
Feel free to consult the biz-friendly OSL Team now to learn more.
| Article Code : | VBS/AT/19102016/Z-4 |